8/10
(Expert Score)
Product is rated as #4 in category Graphic & Design Software
There's no doubt that Piktochart excels in what it does, and it creates some best infographics. The charts and maps can be easily placed and customized. It is on par with Canva, which is a fantastic graphic designing tool. In some cases, Canva is the best option, but if you are a beginner, try Piktochart.
PROS:
- • Create unlimited visuals.
- • No Watermark.
- • Up to 1GB of image storage.
- • Sharp HD pdf image exports.
- • Password protected visuals.
- • Create a custom color scheme and personal colors.
- • Visuals can be organized and sorted into different folders.
- • More image uploading space.
- • Project sharing.
- • Annotated comments
- • Collaboration in designs.
- • Team template customization.
- • Permissions and role setting for team members
CONS:
- • Designs cannot be sorted into folders (free plan).
- • Cap limit of only 5 visual designs (free plan).
- • Only 40MBof image storage (free plan).
- • There's only 1GB storage for images (paid plan).
Contents
Intro | DEAL | Pricing | Features & Benefits | Pros | Cons | Use Cases | Alike Competitors | Company | FAQ | Staff Review | Leave Your Review
Piktochart
What is the best way to design an infographic? After searching online and using different software, we stopped on Piktochart. It is an easy to use online software that allows us to design attention-grabbing flyers and infographics while offering competitive prices. In this review, we’ll try to provide a detailed analysis of Piktochart. How it fares against its competitors while offering amazing features for both businesses and non-profit organizations. We will also look at the use case and discuss which type of companies Piktochart is suitable for.
Recent Deal
Piktochart
Piktochart is a SaaS infographics creation tool which can be utilized to communicate sophisticated in a visual format.
Free 
No Coupon Code
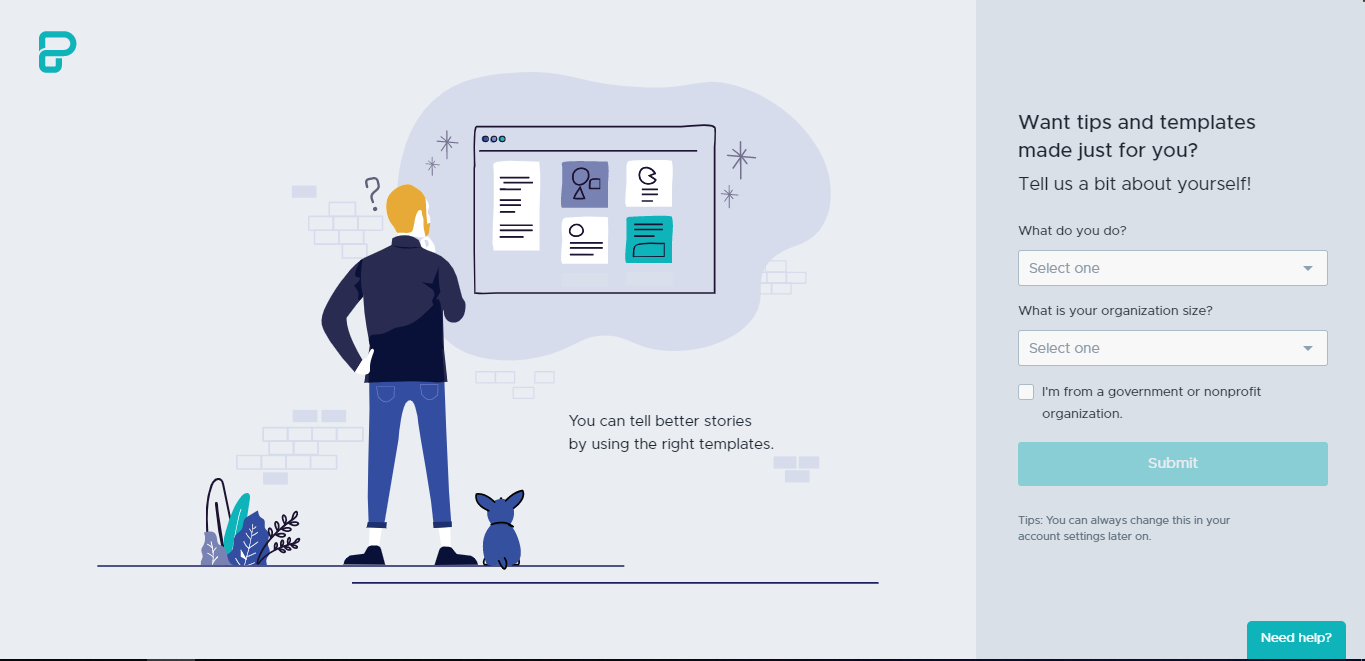
Let’s start with signing-up with Piktochart, which is very easy. After you log in for the first time, you will be taken to the page above, select your profession, and the size of your organization.
After submitting, you will be moved to the next page to choose the topics that you are interested in. It’s up to you whether you want to select anything or move next.
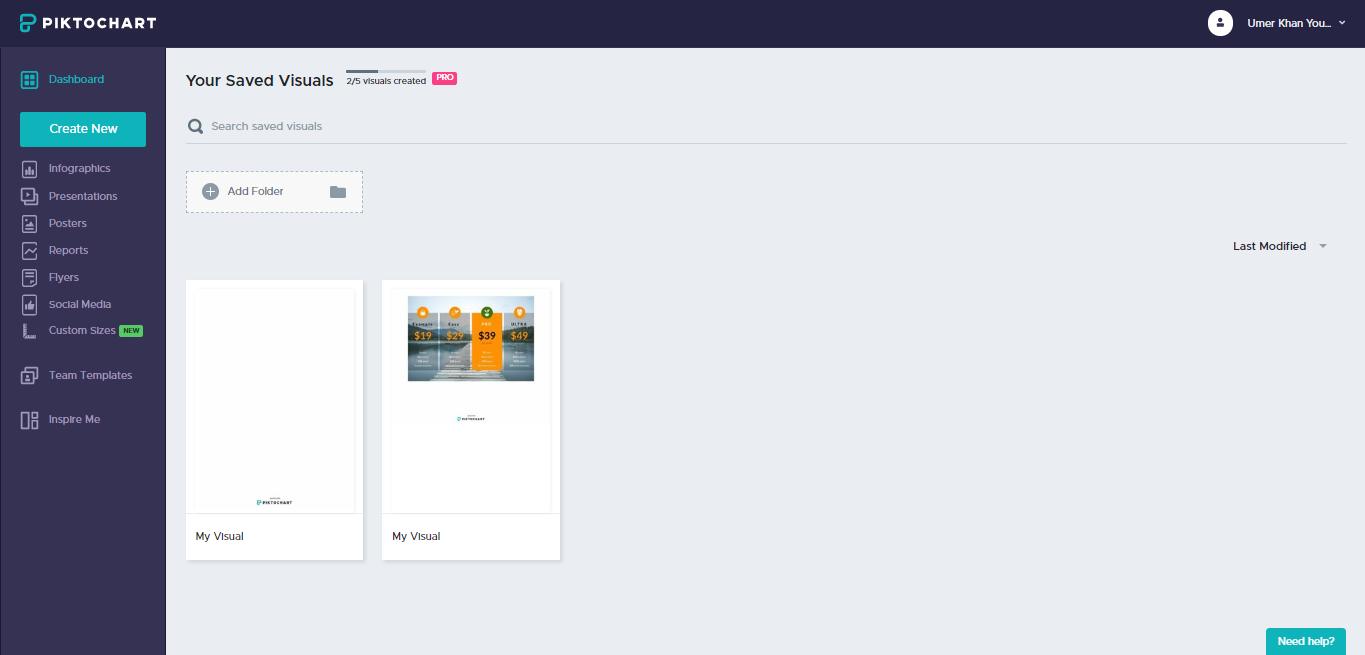
After that, you will be taken to the dashboard. The dashboard of Piktochart is pretty clean and straightforward, there are few options to choose from in the navigation menu, it’s easy for a new user to navigate the platform without any problem.
On the right side of the dashboard panel, you can see your designs. You can also create folders to sort your visuals, but to create folders, you need a premium subscription.
From the dashboard panel, you can select options (such as “infographics”) to choose from thousands of predefined templates that are ready-made and easy to alter.
All you need to do is to edit them, and they’ll be ready for you to export and save.
You can also create the new infographics or designs of your choice (by selecting the “Create New” option from the dashboard). Once you have chosen to create a new design, you can select from predefined options or custom sizes.
After you have selected the design of your choice. You will be taken to the editor to edit the template or create your design from scratch.
Get Our List of Must-Have Free Software Tools
Get the List of These Free Must Have Tools, Today!You're a small business or online entrepreneur, then you need to start using these tools.
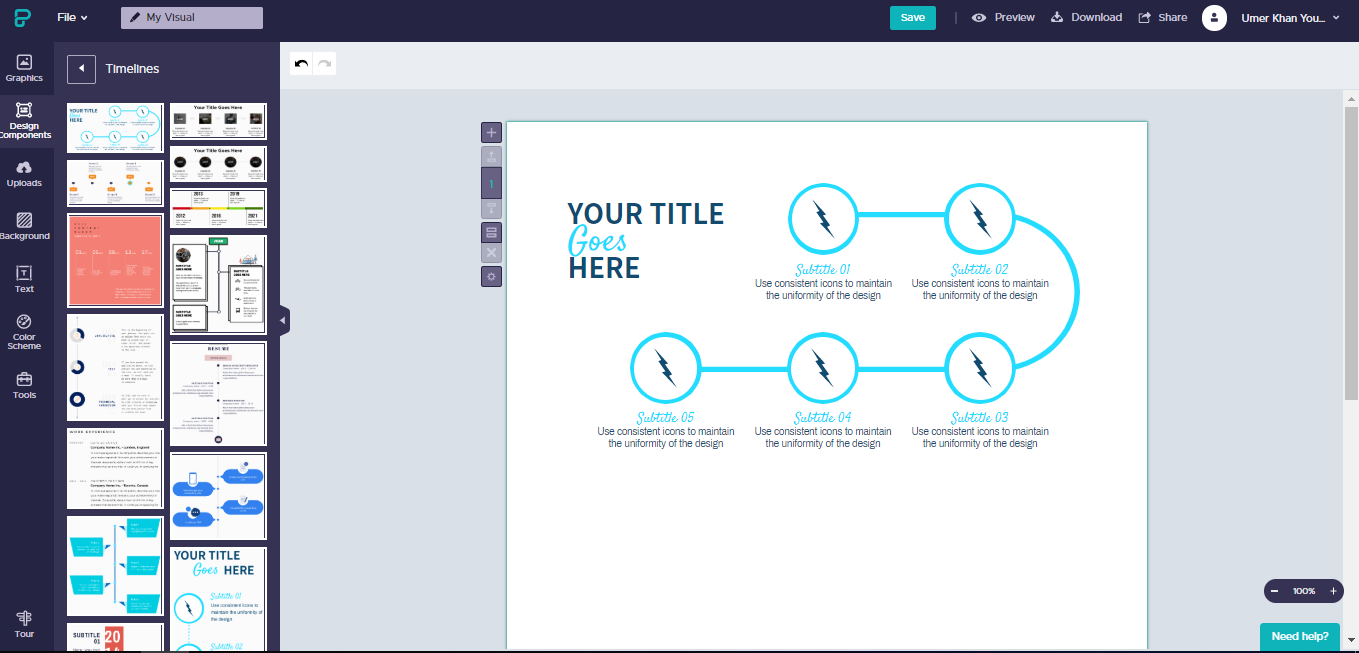
Here in the editor, you can see an editor panel and page. There are different tools and features in the dashboard that can be used to create your design from scratch.
Graphics:
The Graphics section contains shapes, illustrations, and an extensive collection of royalty-free pictures that can be used in the infographics.
Design and Components:
The design and components section contains different visual components, such as timelines, lists, and comparisons.
Uploads:
In uploads, you can upload your images and use them in your designs. For the free version, image storage is capped to 40MB.
Backgrounds:
The background section contains colors, images, and illustrations that can be used as a background from your infographics or designs.
Text:
From the “Text” section, predefined text frames can be selected. You can also choose different text styles and sizes with fonts such as title, subtitle, or body text.
Color Scheme:
The color scheme comes in handy when we want to create different colors according to our infographics. The issue is that this feature is premium, i.e., you will have to purchase a premium subscription to use it.
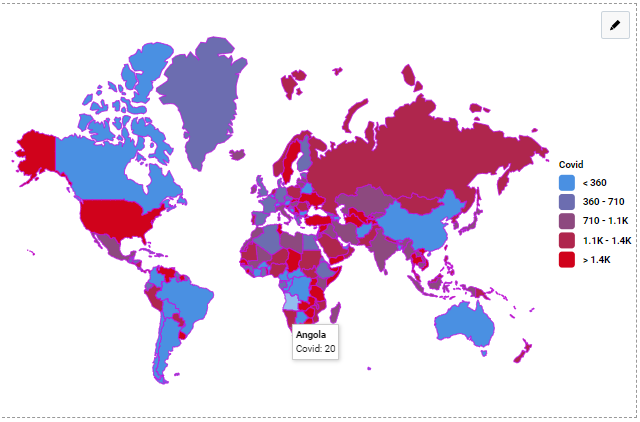
Tools:
“Tools” by far are one of the most amazing features in Piktochart. It contains charts, maps, and videos. All of these components are highly customizable, and you can change the color of borders, add values, and so on.
Tour:
In the last section, the “Tour” section. Piktochart has created gifs to help its users understand how specific features can be used, but unfortunately, they don’t explain the steps in much detail.
They tell users the editor’s basic function, like adding text, icons, photos, blocks, backgrounds, and save & export. For beginners, it is easy to use and quickly figure out.
The editor is easy to use, and in just 10 minutes, you’ll understand how to use it and create many good designs. But one problem is that you can only create 5 designs in the free version, after that you need to buy a subscription for creating more designs.
Pricing
Sendinblue Pricing
Free Plan: Yes
Pro Plan (Single User):
Lowest priced plan: $29/ month (paid monthly) for all the premium features
Highest priced plan: $290 /annually (paid annually) for all the premium features.
PRO Team Plan (6 Users):
Lowest priced plan: $114 / month (paid monthly) for team features and all other premium features.
Highest priced plan: $1,026 / per year (paid annually) for team features and all the other premium features.
The pricing plan of Piktochart is relatively simple. The first 5 designs or visuals are free, and after that, a premium subscription is needed.
The pricing plan is different for a single user and a team of 6 users. If the team comprises more than 6 members, you have to contact customer support for the price. The pricing plan for non-profit and educators is different, as well.
For a single user, it begins at $24.17, giving benefits such as unlimited design creation, 1GB image upload, pdf exports, watermark removal, and much more.
The team plan includes all of the features in Pro Plan (single User) and, in addition to that, more image upload space, team collaboration, sharing of projects, and much more.
However, the pricing plan of Piktochart is costly, and it has less features than its competitor Canva.com, which offers more features than Piktochart at a much lesser price.
The pricing plan of Canva Pro for a team of six members is $59.70/month, and it offers many more features than Piktochart. The free plan of Canva offers teams to create unlimited free designs as compared to Piktochart, which offers only 5 visual designs.
But the components such as customizable charts, maps are amazing features that are not present in Canva.com.
Features & Benefits
PROS
PROS (of the Free Plan):
-
- Create up to 5 visuals.
- Storage up to 40MB of images.
- Visuals can be downloaded in PNG format.
- Published visuals will only be available for public viewing.
Pro plan (single User):
- Create unlimited visuals.
- No Watermark.
- Up to 1GB of image storage.
- Sharp HD pdf image exports.
- Password protected visuals.
- Create a custom color scheme and personal colors.
- Visuals can be organized and sorted into different folders.
Pro plan (team)
- All premium and free features.
- More image uploading space.
- Project sharing.
- Annotated comments
- Collaboration in designs.
- Team template customization.
- Permissions and role setting for team members.
- Much more!!
One of the most amazing features of Piktochart is that it provides annotated comments and collaboration in design to see the changes on the go. It gives its users the ease of sharing and collaborating while engaging with each other.
CONS (for Free Plan)
CONS (Free Plan):
- Designs cannot be sorted into folders.
- Cap limit of only 5 visual designs.
- Only 40MBof image storage.
Cons (for Paid Plan both team and single User)
-
- There’s only 1GB storage for images.
Piktochart, undoubtedly, is a fantastic tool as it offers components such as data charts and maps that make it a strong competitor, but it’s more expensive than other software out there; $114/per month for a team of 6 members is costly. In contrast, Canva offers most of these features at $60.
Overall, Piktochart has a wide range of components and tools that makes designing easy.
If someone wants to design good infographics and more detailed and catchy visuals, then Piktochart is the best option. It offers impressive templates and is on par with its competitor Canva.com.
For small startups and individuals, Canva.com is the best option as it offers free unlimited design creations and team collaboration. But Canva.com lacks a few features such as detailed charts, maps, and visuals.
Use Cases
There are several use cases for local and big businesses as well. Piktochart is a good match for companies and non-profit organizations that have to advertise more frequently and run campaigns. An infographic or flyer is essential in marketing because “A picture is worth a thousand words.”
The main target is to grab as much attention as possible. Piktochart is the best option as it provides detailed visuals and more features, and users can create stunning designs in a few minutes.
- Create amazing, short promotional videos, banners, social media cards, infographics, and much more with Piktochart that will boost your business.
- Infographics are the best way to express an idea colorfully, and statistically, that will be read 30 times more than a normal paragraph.
- Eye-tracking research shows people are more likely to spend 10% more time viewing images than reading text.
- Study shows that 63% of social media contains visual content. So, we can see the importance of visual content.
- Study shows that people are 40X more likely to share visual content on social media.
Similar Competitors
Canva
Canva is Australia based company founded in 2012. It is a graphic designing tool that allows users to create social media posters, infographics, presentations and other visual content. It is available on mobiles and web. Users can choose from tens of thousands of professional templates or they can create their own. As of 2019, the company raised 3.2 billion dollars and is used by 20 million people across the globe.
Infogram
Infogram is a Latvian company based in Riga. It is a web-based data visualization and infographic designing platform. It offers WYSIWYG (What you see is what you get) editor that convert user data into infographic. It was acquired by Prezi in 2017.

Company Profile
Piktochart is a company founded in 2012 in Malaysia. It is an online infographic application used for graphic designing to easily create visuals and infographics. Piktochart claims to have 3 million users in mid-2015. Piktochart is described by Forbes as an infographic tool for “the graphically challenged,” or for those who are simply in a time-crunch. As of 2018, Piktochart is claimed to be used by more than 11 million people in the world
FAQ
If you have any questions, you can visit their support page to contact their support directly.
Piktochart only charges flat prices, without taxes or fees. But you can receive additional charges or fees from your Credit Card or Bank.
- You will be able to access all your visuals that you have created.
- You will be able to edit them as a free user.
- If you have created more than 5 visuals, then you will not be able to create new visuals.
- Download option for your visuals will not include HD support and other premium features.
- Any embedded visual on your website will show the “Piktochart” watermark after you change from “Pro” to “Free” plan.
Any staff member, teacher, student, or librarian can qualify for Education Plan if they are associated with any private or public school/university that is registered with govt.
Contents
Intro | DEAL | Features & Benefits | Pricing | Pros | Cons | Use Cases | Alike Competitors | Company | FAQ | Staff Review | Leave Your Review
Specification: Piktochart – Online Infographic Design Software
| Deployment Type | Wordpress Plugin, SaaS |
|---|---|
| Devices Supported | SaaS |
| Basic Features | CRM integration, Data import/export, Gamification, Open API, Scheduling, Social integration, Tracking |
| Email Marketing Features | 3rd Party Integrations, Advanced Analytics, Advanced Email Sending Features, Basic Analytics, Database Management, Email Autoresponder, Email Broadcasting, Email Templates, Social Media Integrations, Workflow Management, WYSIWYG Email Builder |
| Pricing Model | Annual Subscription, Freemium, Monthly payment |
| Support Provided | Email Support, Phone Support |
Videos: Piktochart – Online Infographic Design Software

Photos: Piktochart – Online Infographic Design Software
User Reviews
Be the first to review “Piktochart – Online Infographic Design Software”
You must be logged in to post a review.
Piktochart – Online Infographic Design Software
$0.00
There are no reviews yet.